Performs Lam's G test, an extension of Cochran's C test, to evaluate the internal consistency of variances. Although it is primarily a variance outlier test rather than a "true" homoscedasticity test such as Levene's test or Bartlett's test, it can still be used conceptually to assess the homogeneity of variances across groups.
Usage
Lam_G_test(
  data,
  formula,
  alpha = 0.05,
  silent = FALSE,
  summary = FALSE,
  misc = FALSE,
  alternative = c("two.sided", "less", "greater")
)
Arguments
- data
A data frame containing the variables specified in the formula.
- formula
A formula of the form
DV ~ IV, whereDVis the dependent (response) variable andIVis the independent (grouping) variable.- alpha
A numeric value specifying the significance level. Must be between 0 and 1. Default is 0.05.
- silent
A logical value. If
FALSE(default), results are printed to the console. IfTRUE, no output is printed.- summary
A logical value (default:
FALSE). IfTRUE, a summary table for the input data is returned.- misc
A logical value. If
FALSE(default), only essential parameters are returned. IfTRUE, additional auxiliary parameters are included in the output.- alternative
Character (default: "two.sided"). Specifies the alternative hypothesis. Available options are c("two.sided", "less", "greater").
Value
A list containing the test statistics, p-value, degrees of freedom,
and optionally a summary table and/or auxiliary parameters,
depending on the values of summary and misc.
Details
Note:
Under normally distributed data and moderate sample sizes (8 < n < 20),
Lam's G test performs comparably to Bartlett's test. For small sample sizes
(n < 8), it appears to outperform several alternative tests, providing a
favorable balance between Type I and Type II error rates. In contrast, some
alternative methods achieve lower Type I error rates at the cost of
substantially higher Type II error rates. Note that this test is highly
sensitive to outliers.
References
’T Lam, R. U. E. (2010). Scrutiny of variance results for outliers: Cochran’s test optimized. Analytica Chimica Acta, 659(1–2), 68–84. https://doi.org/10.1016/j.aca.2009.11.032
Examples
df0 <- roGFP[[1]]
out <- Lam_G_test(df0, ro ~ grp)
#>
#> ---------------------------------------------
#> 't Lam's G homogeneity of variance test
#>
#> Response: ro
#>
#> Outlying group: C
#>
#> F-value: 8.3514
#> F-critical: 3.4001
#> p-value: 1e-05
#>
#> #> Group variances are unequal.
#> ---------------------------------------------
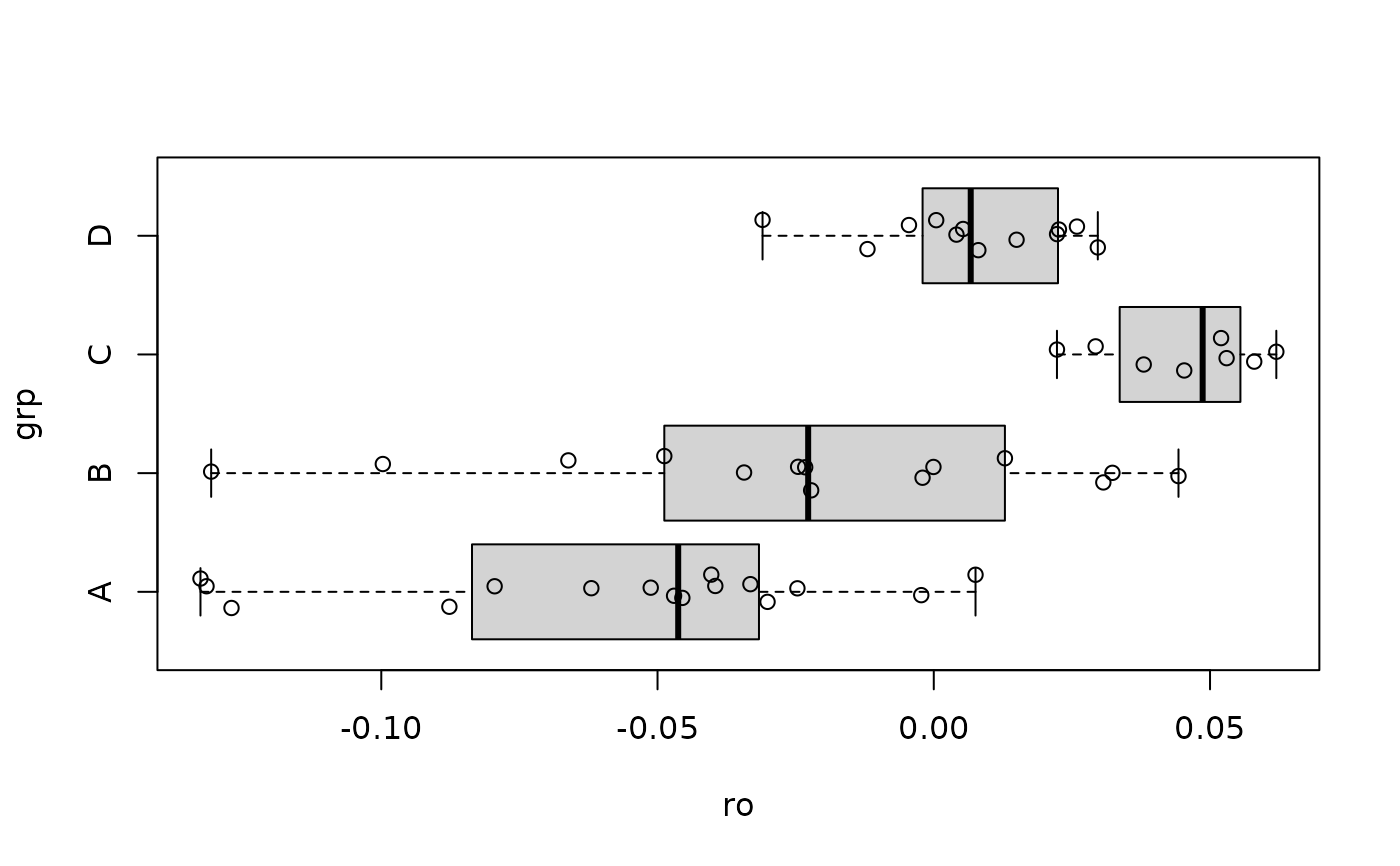
boxplot(ro ~ grp, df0, horizontal = TRUE)
points(x = df0$ro, y = jitter(as.numeric(df0$grp), amount = 0.15))