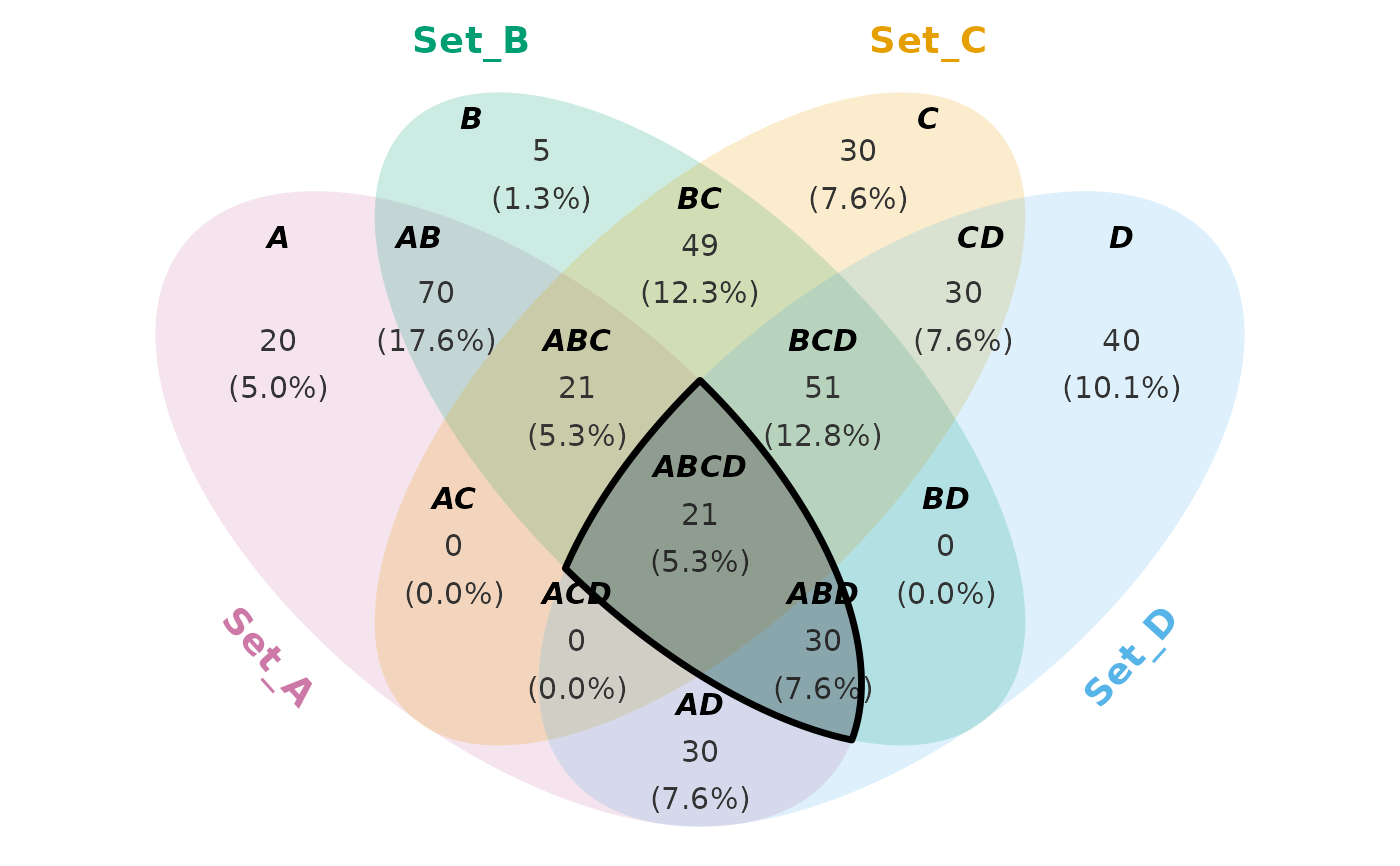
A handy wrapper for the ggplot2::geom_polygon() used to represent the
result of set operations.
Usage
highlight(
  venn,
  setops,
  color = "black",
  linewidth = 1.2,
  linetype = "solid",
  fill = "black",
  alpha = 0.2,
  ...
)
Arguments
- venn
Venn diagram produced from
venny::venny().- setops
The result of set operations.
- color
Character (default: "transparent"). The polygon line color.
- linewidth
Numeric (default: 1.5). The polygon linewidth.
- linetype
Character (default: "solid"). The polygon linetype.
- fill
Character (default: "black"). The polygon color.
- alpha
Numeric (default: 0.4). The polygon transparency (0-1).
- ...
The other arguments passed into
ggplot2::geom_polygon.