O'Neill-Mathews Test of Homogeneity of Variances
Source:R/O.Neill_Mathews_test.R
O.Neill_Mathews_test.RdPerforms O'Neill-Mathews test to assess the null hypothesis that the variances are equal across all groups (samples) defined by the independent variable.
Arguments
- data
A data frame containing the variables specified in the formula.
- formula
A formula of the form
DV ~ IV, whereDVis the dependent (response) variable andIVis the independent (grouping) variable.- alpha
A numeric value specifying the significance level. Must be between 0 and 1. Default is 0.05.
- silent
A logical value. If
FALSE(default), results are printed to the console. IfTRUE, no output is printed.- summary
A logical value (default:
FALSE). IfTRUE, a summary table for the input data is returned.- misc
A logical value. If
FALSE(default), only essential parameters are returned. IfTRUE, additional auxiliary parameters are included in the output.- transform
A function used to transform the response variable into deviations from a specified location measure.
Value
A list containing the test statistics, p-value, degrees of freedom,
and optionally a summary table and/or auxiliary parameters,
depending on the values of summary and misc.
Details
transform:
The concept is similar to ANOVA procedure (transform the response variable to
residuals before analysis). Possible transformation are:
y' = |yi - ybar| (default)
y' = (yi - ybar) ^ 2
y' = ln((yi - ybar) ^ 2)
y' = sqrt(|yi - ybar|)
The ybar could be either mean, median (default), or trimmed-mean.
References
O’Neill, M. E., & Mathews, K. (2000). Theory & Methods: A Weighted Least Squares Approach to Levene’s Test of Homogeneity of Variance. Australian & New Zealand Journal of Statistics, 42(1), 81–100. https://doi.org/10.1111/1467-842X.00109
Examples
df0 <- roGFP[[1]]
out <- O.Neill_Mathews_test(df0, ro ~ grp)
#>
#> ---------------------------------------------
#> O'Neill-Mathews homogeneity of variance test
#>
#> Response: ro
#>
#>           DF   SS   MS Fvalue  pvalue
#> Group      3 0.02 0.01 2.8619 0.04694
#> Residuals 46 0.09    0
#> Total     49  0.1
#>
#> #> Group variances are unequal.
#> ---------------------------------------------
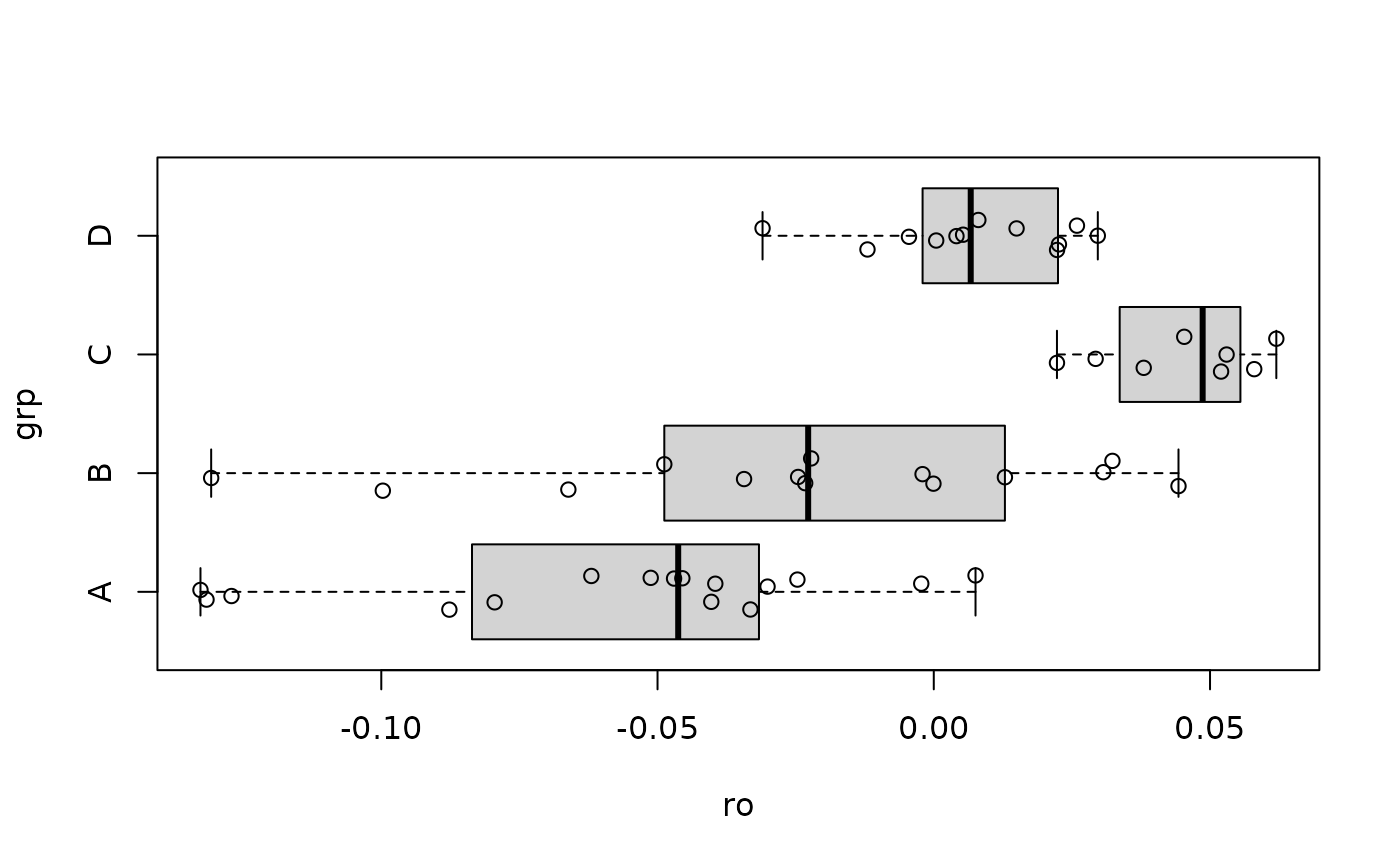
boxplot(ro ~ grp, df0, horizontal = TRUE)
points(x = df0$ro, y = jitter(as.numeric(df0$grp), amount = 0.15))