Ansari-Bradley Test of Homogeneity of Variances
Source:R/Ansari_Bradley_test.R
Ansari_Bradley_test.RdPerforms Ansari-Bradley test to assess the null hypothesis that the variances are equal across all groups (samples) defined by the independent variable.
Usage
Ansari_Bradley_test(
  data,
  formula,
  alpha = 0.05,
  silent = FALSE,
  summary = FALSE,
  misc = FALSE
)
Arguments
- data
A data frame containing the variables specified in the formula.
- formula
A formula of the form
DV ~ IV, whereDVis the dependent (response) variable andIVis the independent (grouping) variable.- alpha
A numeric value specifying the significance level. Must be between 0 and 1. Default is 0.05.
- silent
A logical value. If
FALSE(default), results are printed to the console. IfTRUE, no output is printed.- summary
A logical value (default:
FALSE). IfTRUE, a summary table for the input data is returned.- misc
A logical value. If
FALSE(default), only essential parameters are returned. IfTRUE, additional auxiliary parameters are included in the output.
Value
A list containing the test statistics, p-value, degrees of freedom,
and optionally a summary table and/or auxiliary parameters,
depending on the values of summary and misc.
Details
This function is based on Conover et al. (1981) and uses an approximate chi-square test. Results may be inaccurate for small total sample sizes (N < 20) or when there are many tied values.
References
Ansari, A. R., & Bradley, R. A. (1960). Rank-sum tests for dispersions. The Annals of Mathematical Statistics, 31, 1174–1189.
Conover, W. J., Johnson, M. E., & Johnson, M. M. (1981). A comparative study of tests for homogeneity of variances, with applications to the outer continental shelf bidding data. Technometrics, 23, 351–361. https://doi.org/10.1080/00401706.1981.10487680
Examples
df0 <- CYCB1[[1]]
out <- Ansari_Bradley_test(df0, cells ~ grp)
#>
#> ---------------------------------------------
#>  Ansari-Bradley homogeneity of variance test
#>
#>  Response: cells
#>
#>  Chi-Square: 8.3518
#>  Chi-Square critical: 7.8147
#>  p-value: 0.03927
#>
#>  #> Group variances are unequal.
#> ---------------------------------------------
#>
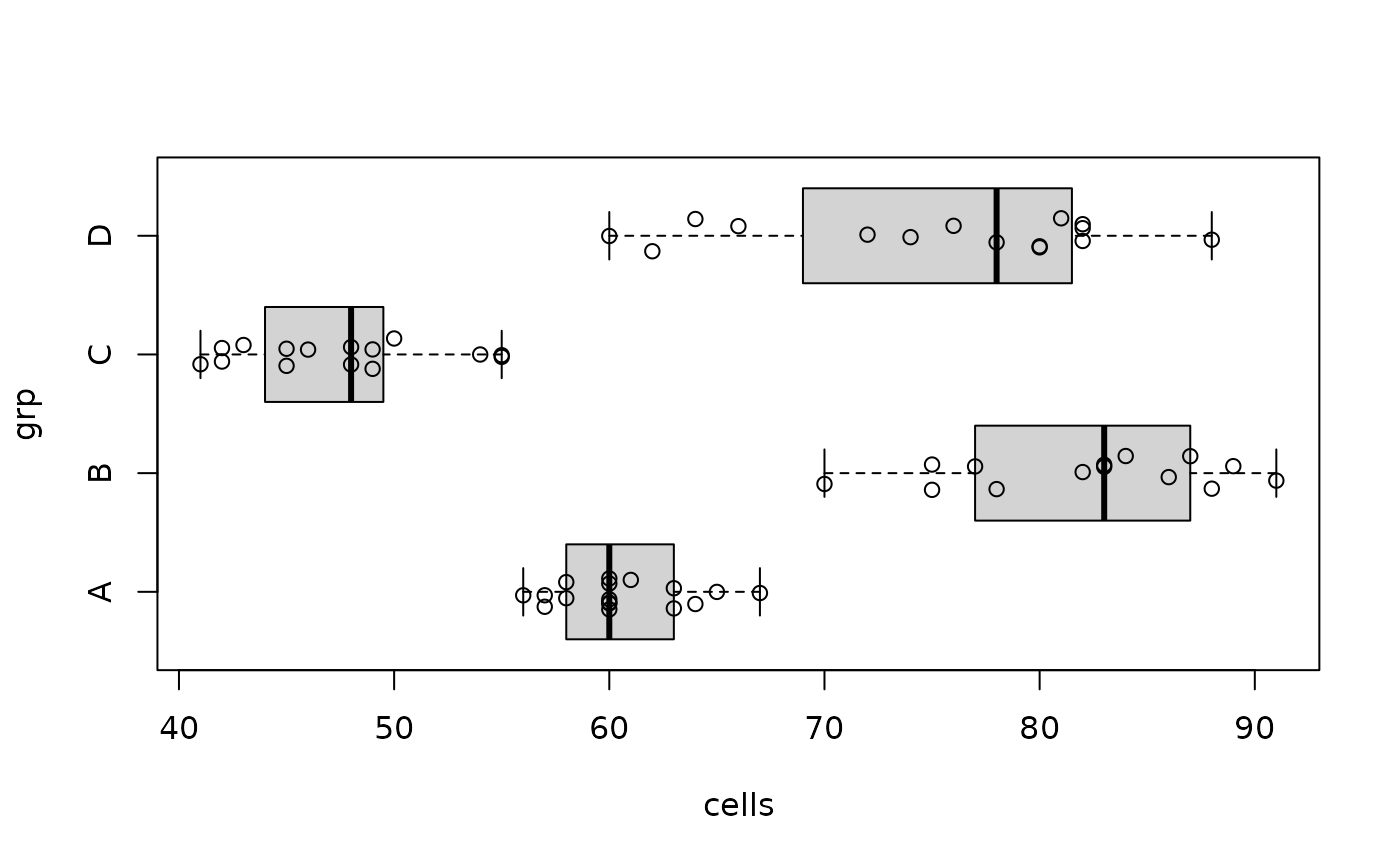
boxplot(cells ~ grp, df0, horizontal = TRUE)
points(x = df0$cells, y = jitter(as.numeric(df0$grp), amount = 0.15))